

Subscribe and receive email notifications of new blog posts.
 RSS Feed
6
Bend Oregon Housing Market Trends for October 2026
Bend Oregon Housing Market Trends for October 2026
The Bend housing market slowed further in October 2026 as mortgage rates averaging approximately 7.3% reduced buyer purchasing power and kept many financed buyers on the sidelines.
The median sales price declined 3.6%, closed sales fell 16.8%, and pending sales dropped 17.4% compared with October 2025. At the same time, cash purchases increased sharply and represented nearly 40% of completed sales.
These numbers do not indicate a housing crash or an oversupply of Bend homes. They show a market constrained by affordability, with fewer buyers able or willing to purchase at today's combination of home prices and borrowing costs.
For current statistics, previous monthly reports and a broader explanation of local conditions, visit our Bend Oregon Real Estate Market guide.
The statistics in this report compare October 2026 with October 2025 and include Bend single-family homes on less than one acre.
October 2026 Bend Real Estate Market Snapshot
-
Average mortgage rate: 7.3% — up 17.3%
-
Median sales price: $732,500 — down 3.6%
-
Closed sales: 139 — down 16.8%
-
Sold price per square foot: $384 — down 1%
-
Original list price received: 95.2% — up 2.1%
-
Cash sales: 39.6% — up 37.7%
-
Total sold volume: $131,184,467 — down 17.2%
-
List-to-close time: 88 days — down 14.6%
-
Sales with seller concessions: 45.3% — up 5.1%
-
Average concession amount: $9,980 — down 0.2%
-
New listings: 132 — down 2.9%
-
Pending sales: 109 — down 17.4%
-
Active inventory: 486 homes — down 12.9%
-
Months of inventory: 3.5 months — up 4.6%
-
Unsold listings: 67 — up 4.7%
Bend Home Prices Softened in October
The median sales price for Bend single-family homes was $732,500 in October, down 3.6% from the same month last year. The sold price per square foot declined 1% to $384.
Having both measures decline provides stronger evidence of price softness than a change in the median price alone. However, the two figures also suggest that Bend is experiencing a measured adjustment rather than a sharp collapse in property values.
The larger change is occurring in the number of transactions.
Only 139 homes closed during October, down 16.8%. Total sold dollar volume declined 17.2% to approximately $131.2 million. Bend therefore experienced considerably less market activity even though prices declined only moderately.
This continues the weakening demand first identified in our September 2026 Bend housing market report. Prices are adjusting gradually, while transaction volume is absorbing the greater effect of higher mortgage rates.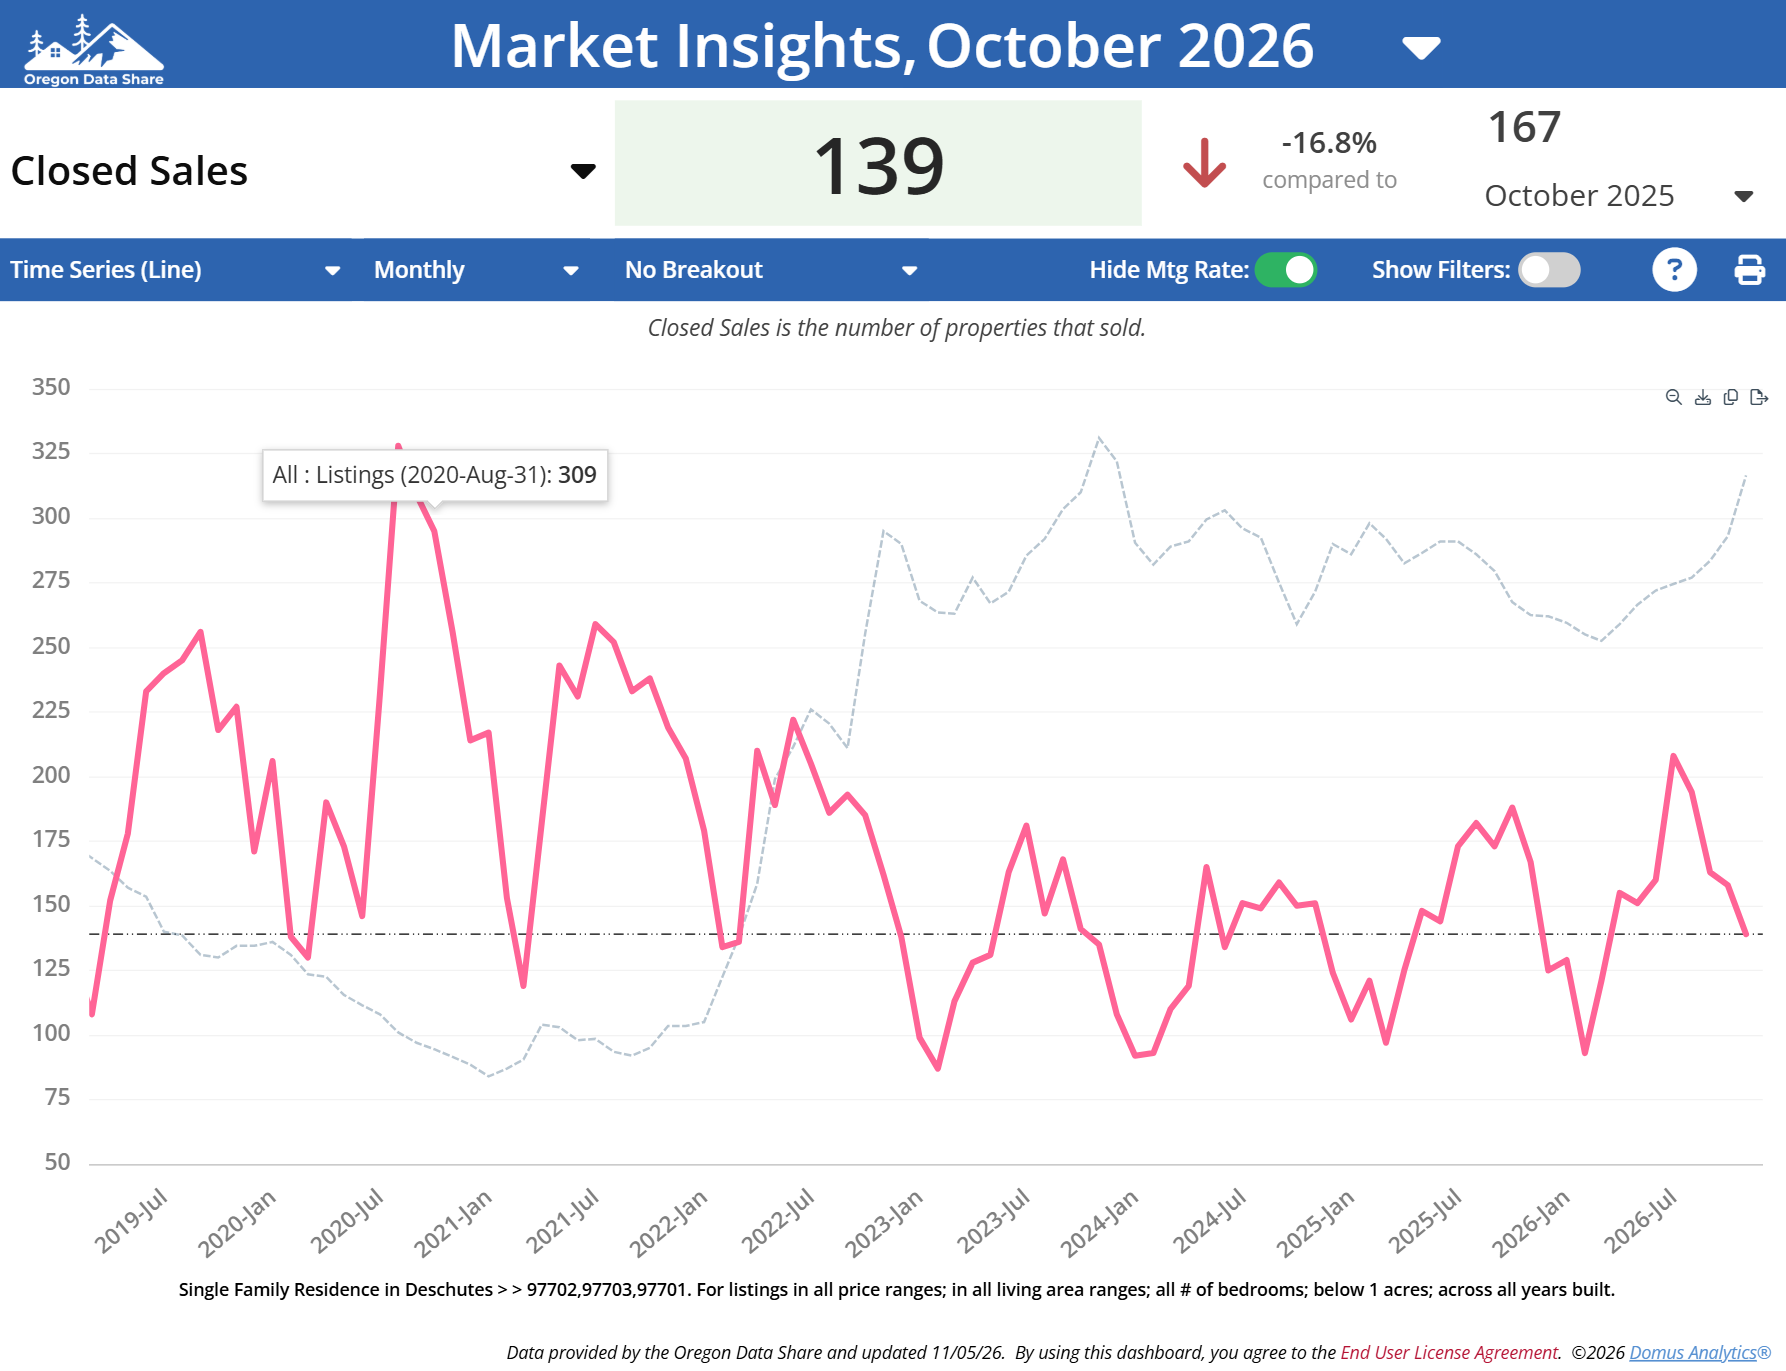
Mortgage Rates Are Restricting Purchasing Power
Mortgage rates averaged approximately 7.3% during October, 17.3% higher than they were a year earlier.
Freddie Mac's weekly mortgage-rate survey showed the average 30-year fixed mortgage rate beginning October at 7.28%, reaching 7.40% during the middle of the month and ending October at 7.24%. According to the Realtor.com October housing report, the monthly average was approximately 7.33%.
The effect on a typical Bend purchase is substantial.
Using October's $732,500 median sales price and a 20% down payment, a buyer would finance approximately $586,000. The estimated monthly principal-and-interest payment would be:
-
Approximately $4,017 at a 7.3% mortgage rate
-
Approximately $3,598 at a 6.22% mortgage rate, roughly where rates were one year earlier
That is a difference of approximately $419 per month—or more than $5,000 per year—without any increase in the price of the home. Property taxes, homeowners insurance and association dues would be additional.
For some buyers, the higher payment makes the purchase less comfortable. For others, it prevents them from qualifying at all.
Cash Buyers Represented Nearly 40% of October Sales
Cash purchases accounted for 39.6% of Bend's October closings, up 37.7% from last year.
This does not necessarily indicate that overall demand is strengthening. Instead, it demonstrates how much the composition of the buyer pool has changed.
Cash buyers are not directly affected by mortgage rates. When financed buyers withdraw from the market, cash buyers naturally represent a larger percentage of the remaining sales.
This can be particularly noticeable in Bend because the market includes second-home purchasers, retirees, investors and buyers arriving with proceeds from the sale of property in more expensive markets.
The sharp increase in cash purchases should therefore be interpreted alongside the 16.8% decline in total closed sales. Cash buyers are taking a larger share of a smaller market.
Pending Sales Point to Continued Weakness
Only 109 Bend homes entered pending status during October, down 17.4% from October 2025.
Because pending contracts typically become future closings, this figure suggests that sales activity will remain subdued as Bend moves toward the end of the year.
Nationally, the number of homes under contract fell 10.5% year over year in October, while new contract signings declined 17%. Bend's 17.4% drop in pending sales closely tracks the national decline in newly signed contracts.
This is more than the customary seasonal slowdown. Buyers and sellers expect fewer transactions in late fall, but the year-over-year comparison removes much of that seasonal effect. October 2026 was materially slower than October 2025.
Fewer Listings Did Not Prevent Months of Supply From Rising
Bend had 486 active single-family listings at the end of October, down 12.9% from last year. New listings also declined 2.9% to 132.
Despite having fewer homes available, months of inventory increased 4.6% to 3.5 months.
That combination is important. Months of inventory rises when the pace of sales slows relative to the number of homes available. Bend did not gain supply because a large wave of new listings entered the market. Supply increased because buyer demand weakened faster than inventory declined.
This helps explain why buyers can experience greater negotiating leverage even though active inventory remains below last year's level.
With 3.5 months of supply, Bend is not in a traditional buyer's market. However, sellers are competing for a smaller pool of qualified and motivated purchasers.
Buyers can view current Bend homes for sale to compare asking prices, available inventory and property features.
Seller Concessions Remain Common
Seller concessions were included in 45.3% of October closings, up 5.1% from last year. The average concession was $9,980, essentially unchanged.
Concessions may be used to cover buyer closing costs, prepaid expenses or an interest-rate buydown. With mortgage rates above 7%, assistance that reduces the buyer's monthly payment can be more valuable than an equivalent reduction in the purchase price.
For example, a $10,000 price reduction produces only a modest change in the payment on a 30-year loan. Applying the same amount toward financing costs may provide the buyer with more immediate affordability relief, depending on the lender's available programs.
Our comparison of a seller-paid rate buydown versus a price reduction explains how the same seller contribution can affect a buyer's payment differently.
For sellers, concessions reduce net proceeds. A home may appear to have sold relatively close to its asking price while the seller also contributed nearly $10,000 toward the transaction.
The recorded sales price does not always tell the full story.
Homes Received 95.2% of Their Original Asking Price
October sales closed for an average of 95.2% of the original list price, up 2.1% from a year earlier.
That does not mean sellers regained pricing power. This statistic includes only properties that successfully sold. It excludes homes that remained active or left the market without a buyer.
It can also reflect sellers pricing more realistically at the beginning rather than relying on a series of reductions. A well-priced home may sell near its original asking price even in a slower market.
Meanwhile, the broader Western market continues to experience considerable pricing pressure. Nationally, 20.5% of active listings had received a price reduction in October, including 21.6% in the West. Portland had one of the country's highest reduction rates at approximately 31%.
The lesson is straightforward: buyers will respond to value, but they are unlikely to rescue an overpriced listing.
Why Did List-to-Close Time Decline?
The average list-to-close period was 88 days, down 14.6% from October 2025.
That may seem inconsistent with declining sales and weak buyer demand. However, list-to-close time measures only properties that completed a sale.
The homes that closed were generally those that:
-
Entered the market at a competitive price
-
Adjusted promptly when buyer response was weak
-
Showed well compared with competing homes
-
Offered concessions or favorable terms
-
Matched the needs of the smaller active buyer pool
Listings that remained overpriced, accumulated market time or left the market unsold are not represented in the closed-sale timing figure.
A faster average among successful sales does not mean every Bend listing is selling more quickly.
Unsold Listings Remained Elevated
October had 67 unsold listings, up 4.7% from last year. This category includes properties that were withdrawn, canceled or expired without being relisted.
The increase was much less dramatic than September's year-over-year jump, but the number remains important. Some sellers are choosing to leave the market rather than accept a lower price or offer concessions.
This creates a divide:
-
Sellers who need to move are adjusting price and terms.
-
Sellers with flexibility are often waiting for better conditions.
Some withdrawn listings may return next spring. If they do, they could compete with newly listed properties and contribute to higher inventory during the 2027 selling season.
How Does Bend Compare With Oregon and the Nation?
October's slowdown was not limited to Bend.
According to October Oregon housing-market data, the statewide median sold price was approximately $512,000, up 2.4% from a year earlier. However, price per square foot declined approximately 2%, active inventory increased about 9%, and homes spent a median of 72 days on the market.
Nationally:
-
Pending inventory declined 10.5%.
-
New contract signings fell 17%.
-
The median listing price declined 2.2%.
-
New listings fell 7.5%.
-
Active inventory increased 7.4%.
-
Approximately 20.5% of listings had a price reduction.
Realtor.com described the national market as one in which both buyers and sellers had pressed pause. Buyers were staying out because of higher rates, while many prospective sellers were postponing their plans rather than entering a difficult market.
Bend shares that national affordability problem, but its inventory picture is different. National active inventory increased, while active listings within this Bend single-family-home segment declined 12.9%.
The Bend slowdown is therefore being driven primarily by constrained demand—not by an overwhelming supply of homes.
Is Bend Experiencing a Housing Market Correction?
Bend is experiencing a correction in transaction volume, purchasing power and seller expectations. October also provided additional evidence of modest price correction.
Indicators of weakening include:
-
Median sales price down 3.6%
-
Sold price per square foot down 1%
-
Closed sales down 16.8%
-
Pending sales down 17.4%
-
Sold dollar volume down 17.2%
-
Months of inventory up despite fewer active listings
-
More than 45% of sales including concessions
Factors limiting the likelihood of a more severe correction include:
-
Active inventory remains below last year.
-
New listings are also down.
-
Months of supply remains moderate at 3.5.
-
There is no indication of widespread distressed selling.
-
Cash buyers remain active.
-
Correctly priced homes continue to sell.
The current market is better described as a low-transaction correction than a crash. Fewer buyers and sellers are successfully completing transactions, while prices are adjusting more slowly.
Correct Pricing Is Essential in a Low-Transaction Market
When the number of buyers declines, every listing competes for a smaller audience.
Sellers may see that inventory is lower than last year and assume that limited supply will protect an ambitious asking price. But lower inventory does not create urgency when buyers cannot afford—or do not perceive value in—the homes available.
Learning how to price a Bend home for the current market begins with recent comparable sales, competing listings and an honest evaluation of buyer demand.
A successful October pricing strategy needed to account for:
-
Recent closed sales
-
Current competing listings
-
Pending and failed listings
-
Price reductions within the immediate price range
-
Seller concessions
-
Property condition and updates
-
Current mortgage payments
-
Competing new-construction incentives
-
The likely buyer for the property
Starting too high can cost a listing its best opportunity for attention. Once a home has accumulated market time and undergone repeated reductions, buyers may conclude that the seller is increasingly motivated and negotiate more aggressively.
Price is not the only possible obstacle. Our guide to the reasons a home may not be selling explains how condition, presentation, showing access and marketing can also affect buyer response.
The first price should be defensible in the current market—not based on what a similar home might have sold for when mortgage rates were substantially lower.
What October Means for Bend Buyers and Sellers
For buyers, October offered greater negotiating opportunity but continued affordability challenges. Sellers may be receptive to price reductions, closing-cost assistance or an interest-rate buydown. Buyers should compare the monthly and long-term effects of each option with their lender.
For sellers, the market remains functional, but the margin for pricing error has narrowed. Bend still has limited supply relative to many national markets, yet that advantage cannot overcome a 7.3% mortgage rate when a home is overpriced.
Cash buyers are playing an outsized role, financed buyers are purchasing more cautiously, and nearly half of completed sales require concessions.
Homes can still sell successfully. But sellers must respond to the market that exists today—not the market they remember from several years ago.
Frequently Asked Questions About the Bend Housing Market
What was the median Bend home price in October 2026?
The median sales price for Bend single-family homes on less than one acre was $732,500, down 3.6% from October 2025.
Why did Bend home sales decline in October?
Closed sales declined 16.8% as mortgage rates averaging approximately 7.3% reduced buyer purchasing power. Some buyers moved into lower price ranges, while others postponed purchasing altogether.
Are Bend home prices falling?
The October median sales price declined 3.6%, while sold price per square foot fell 1%. These figures indicate modest price softness, although changes vary by neighborhood, price range, condition and property type.
Is Bend a buyer's market?
Bend had 3.5 months of inventory in October, which is not generally considered a traditional buyer's market. However, weaker demand, seller concessions and fewer competing buyers are giving qualified purchasers meaningful negotiating leverage.
Why did cash sales increase so much?
Cash purchases represented 39.6% of October closings because cash buyers are insulated from high mortgage rates. Cash buyers also accounted for a larger share because the number of financed transactions declined.
How common are seller concessions in Bend?
Seller concessions were included in 45.3% of October closings. The average concession was $9,980.
What does 95.2% of original list price mean?
On average, successfully closed homes sold for 95.2% of their initial asking price. This statistic does not include listings that remained active or left the market without selling, and it does not account for seller concessions.
Is the Bend housing market crashing?
No. Bend is experiencing a significant slowdown and modest price correction, but active inventory remains below last year, months of supply is moderate, and there is no evidence of widespread distressed selling.
What is the most important advice for Bend sellers?
Price the home accurately when it first enters the market. In a low-transaction environment, buyers focus on the properties offering the strongest combination of price, condition and terms.
Wondering how these market conditions affect your property? Request a Bend home value report or contact a Bend Premier Real Estate broker for a property-specific market analysis.
Privacy Policy / DMCA Notice / ADA Accessibility


